overleaf template galleryLaTeX examples
Examples to help you learn how to use powerful LaTeX packages and techniques.
Categories

Select from an array of journal templates and submit directly from Overleaf.

Create bibliographies in LaTeX quickly and easily using packages like bibtex, natbib, and biblatex.

Book templates to write your next best seller—whether you're writing a short story or a textbook.

Keep organized with this handy collection of LaTeX calendar templates.

Make the right first impression with our popular range of CV templates.

Format formal letters fast with our range of LaTeX letter templates.

LaTeX templates for homework assignments to use at school, college, and university.

Keep colleagues or contacts informed in style with one of our LaTeX newsletter templates.

Showcase your work with these eye-catching LaTeX poster templates.

Communicate more effectively with our selection of engaging presentation templates.

Templates to help you tackle the most important piece of work you'll produce as a student.
Recent

Ukázková prezentace pro účastníky workshopu na konferenci v Českých Budějovicích 2015. (Sample presentation to workshop participants at a conference in the Czech Budejovice 2015.)
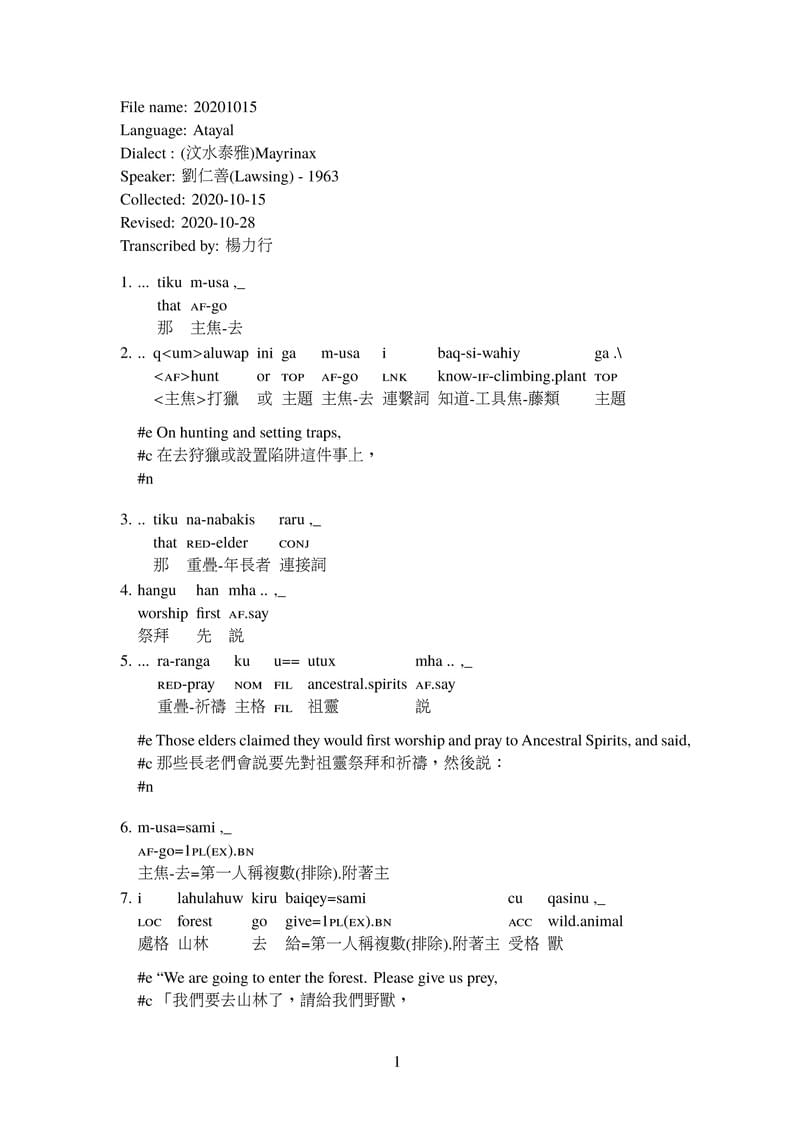
This is a template for language glossing

La bandera de Namibia fue diseñada por el sudafricano Frederick Gordon Brownell, funcionario de la Oficina Nacional de Heráldica de Sudáfrica, cuando dicha nación se independizaba de Sudáfrica. Sus colores están basados en la bandera del movimiento político SWAPO (South West Africa People's Organization, Organización del pueblo de África del Sudoeste, en castellano). La bandera fue adoptada oficialmente por el gobierno de Namibia el día 21 de marzo de 1990. Como otras banderas, su relación largo/alto es 3:2 y su hoja de construcción y colores aproximados se encuentran en el enlace https://en.wikipedia.org/wiki/Flag_of_Namibia. Para este diseño, el fondo es de colores Ultramarino y Verde en diagonal y sobre éste hay dos líneas: una blanca de 0,33 veces el alto y otra roja con un grosor de 0.25. La estrella es de color Dorado con una circunferencia interna de borde Ultramarino.

La bandera de la Región Administrativa Especial de Hong Kong, hoy bajo administración de la República Popular China, fue adoptada el día 4 de abril de 1990 en la Tercera Sesión del Congreso Nacional del Pueblo y fue izada oficialmente el 1 de julio de 1997, en una ceremonia en la cual la soberanía de Hong Kong pasó del Reino Unido a China. El color de fondo de la bandera, según las especificaciones del gobierno de Hong Kong debe ser igual al rojo de la bandera nacional, para lo cual se usó el color HTML expresado como #CF142B. El símbolo que está en la bandera, es el de la flor nacional local, similar a la orquídea, del árbol "Bauhinia blakeana". Esta "orquídea" estilizada está inscrita en una circunferencia que debe abarcar el 60% del alto de la bandera y ubicada en su centro geométrico y cada "pétalo" debe llevar una estrella de 5 puntas con una inclinación de 25 grados. La relación alto/largo de la bandera es 3:2 y su esquema de construcción aproximado aparece en el enlace HKSARFlagConstructionSheet.svg. Una mitad de cada pétalo es un semicírculo, mientras que la otra mitad está formada por tres arcos definidos por la función \draw [opciones] (punto inicial) [out=ángulo de salida, in=ángulo de entrada] (punto final). En la parte final del código, aparece una pequeña etapa para comprobar la geometría de la orquídea, quitándole los signos de comentario a cada una de las órdenes.
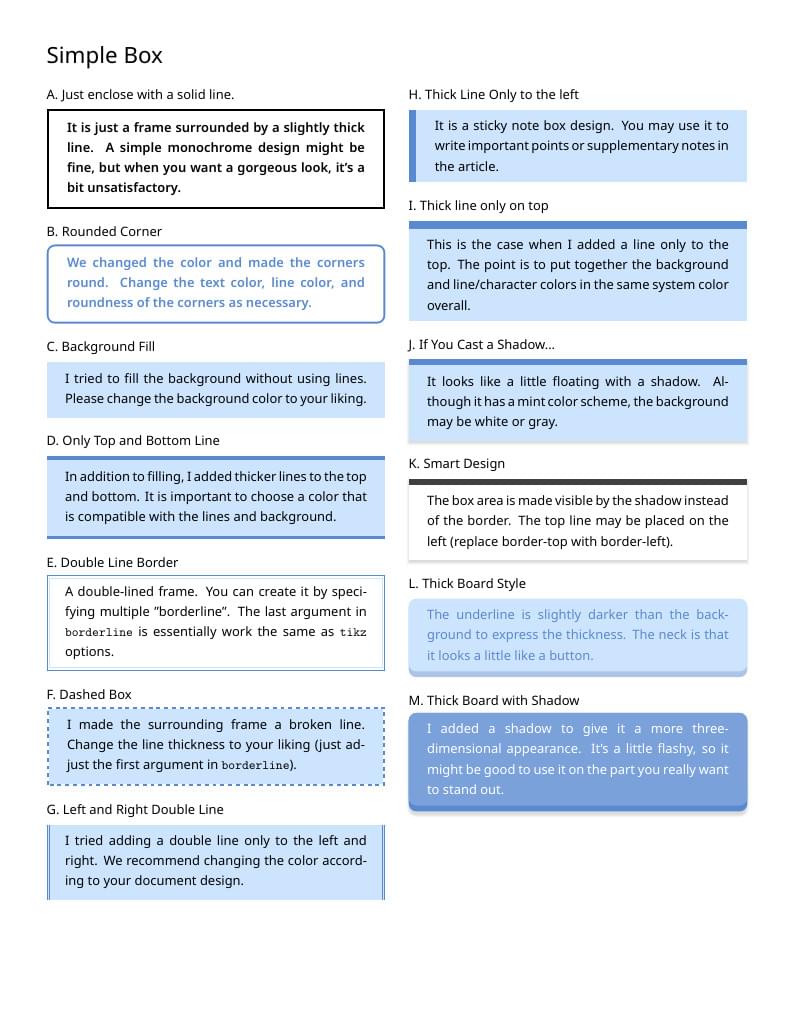
Here, we will introduce 13 stylish box design examples for your LaTeX document. The main package used in this example is tcolorbox and mathspec for better font selection. The rest of the packages in this project are optional.
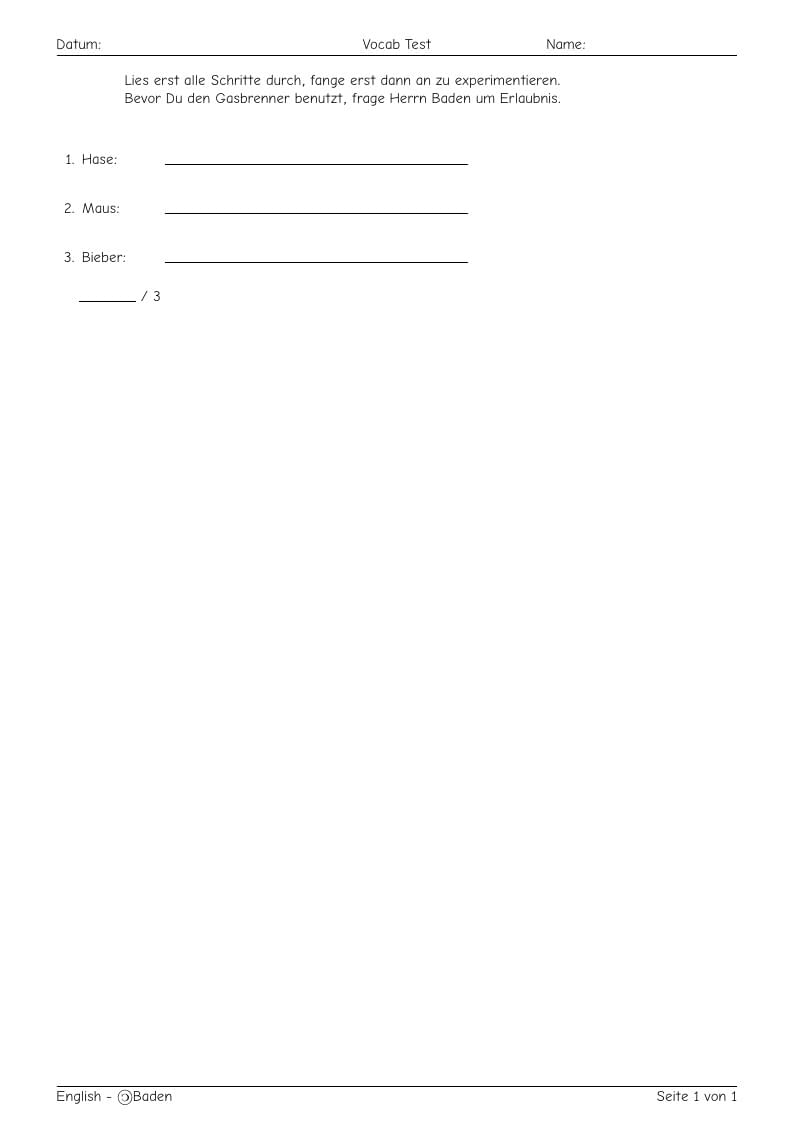
Example using the exam class and datatool to process CSV data.
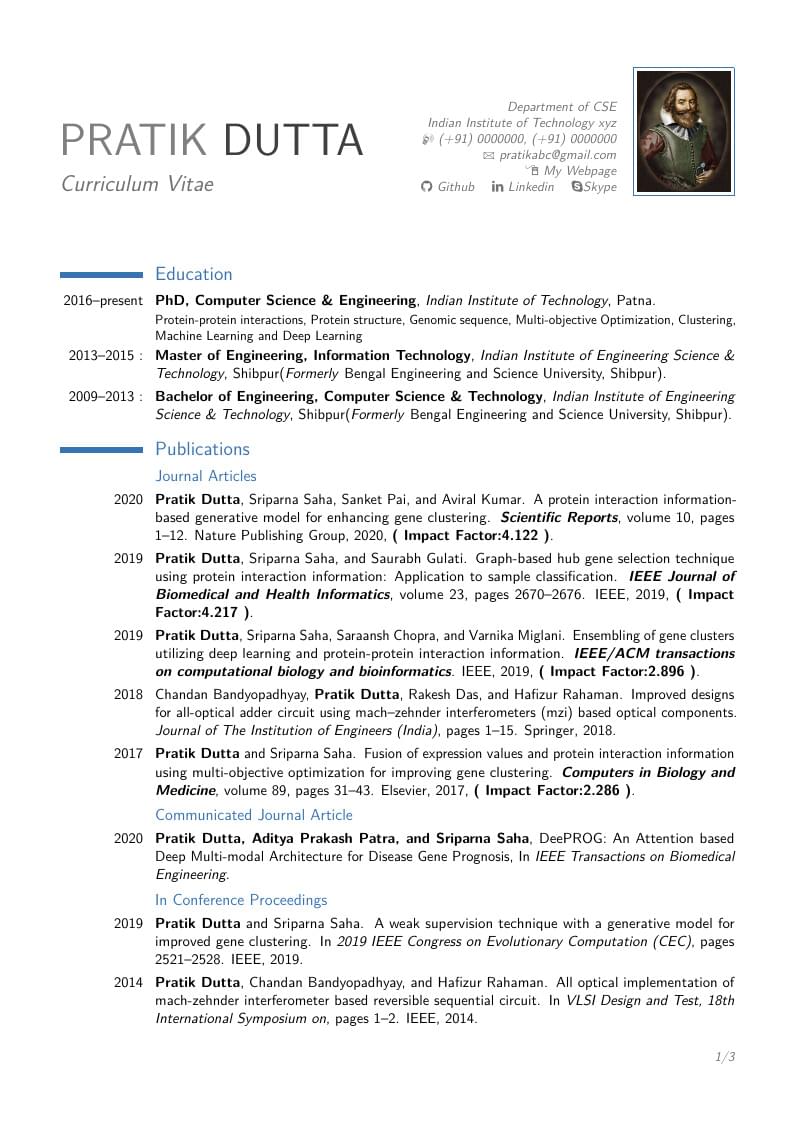
A CV for academicians (researchers, professors, ) that is designed on moderncv template. Here, the publications are automatically sorted in reverse chronological order. You just need to add BibTeX format of your publications in conference.bib or journal.bib

Esta imagen es una "carta de ajuste", dividida en 2 franjas o patrones, usada en televisión de Definición Estándar, con relación ancho/alto de 4:3, para comprobar la fidelidad de las señales de color transmitidas. Este patrón, en la actualidad, se encuentra incorporado a los equipos usados para las pruebas de video de monitores y transmisores que se encuentran en mantenimiento. La cantidad de barras, dimensiones y tonalidades de color en cada patrón se encuentran definidas en la norma estadounidense EIA-189-A, descrita en parte en el documento "Audio/Video Connectivity Solutions for Virtex-II Pro and Virtex-4 FPGAs" página 358.
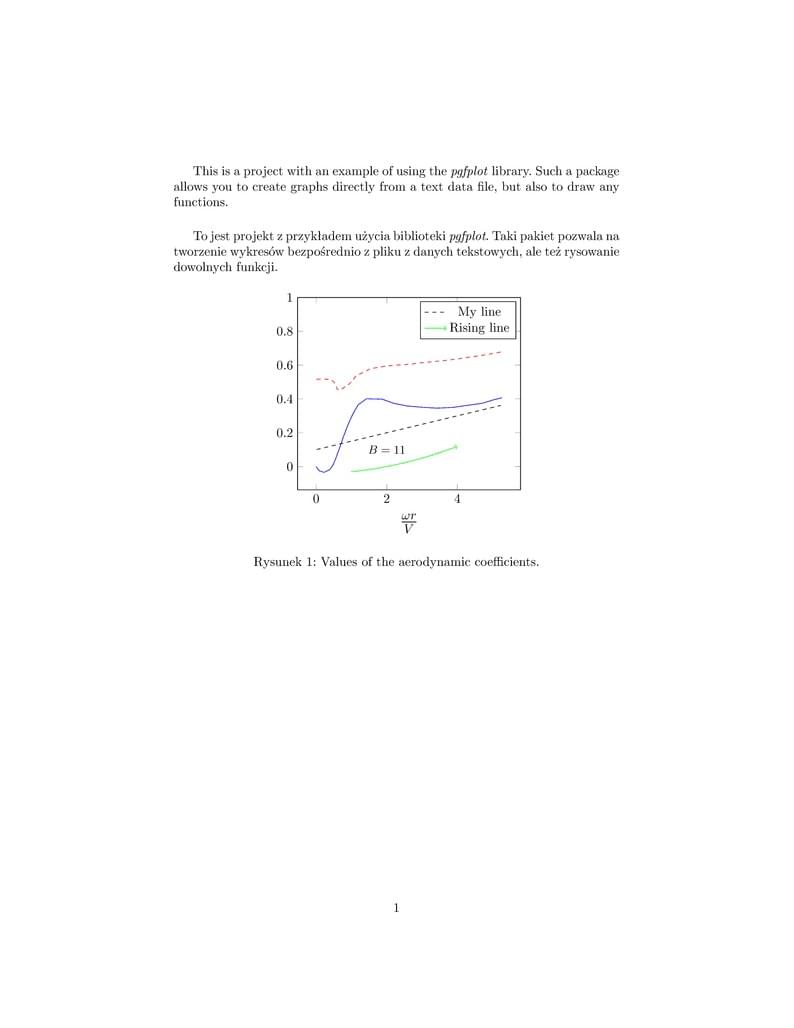
A simple example of pgfplot application. This plot uses data from a text file where data are organized in columns. You can see how to draw the most straightforward way and a few methods for data manipulation in your tex file.
\begin
Discover why over 25 million people worldwide trust Overleaf with their work.