overleaf template galleryLaTeX templates and examples — Recent
Discover LaTeX templates and examples to help with everything from writing a journal article to using a specific LaTeX package.
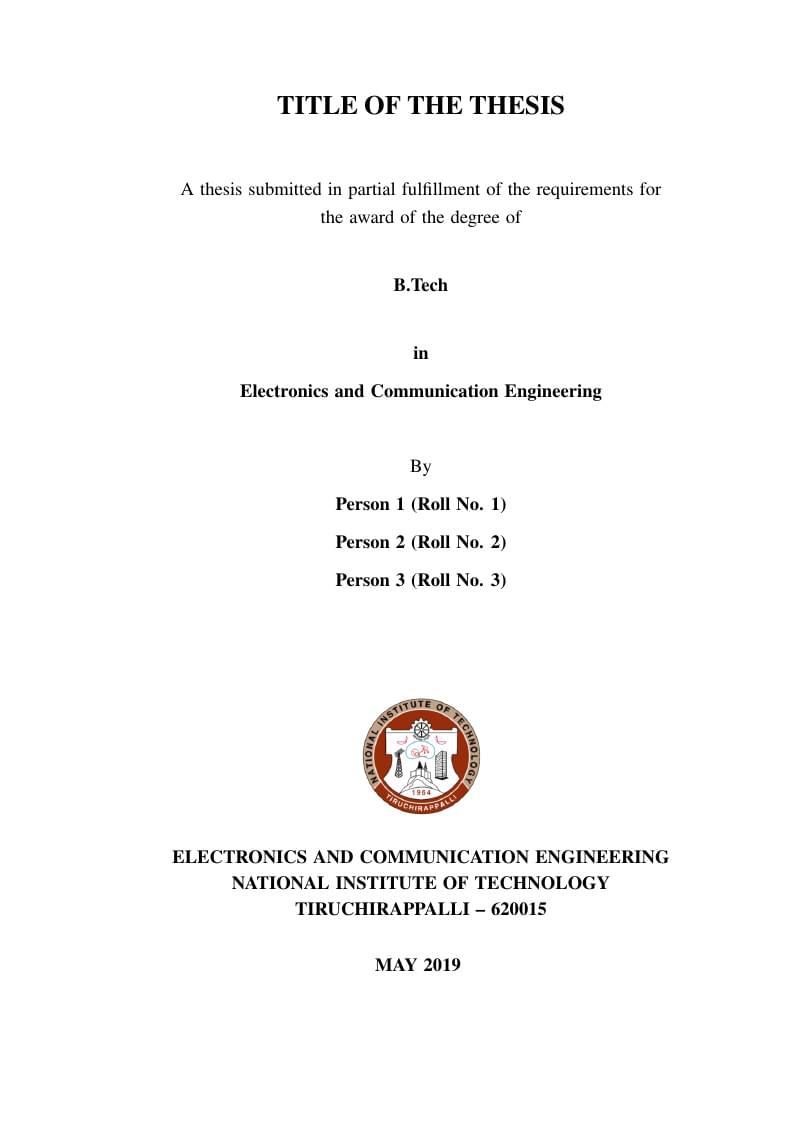
This is a LaTeX template for NIT Trichy B.Tech Project Thesis. If you know a bit of LaTeX, you'll find this very useful.

Ronak Dedhiya's CV. Created with the AltaCV template.
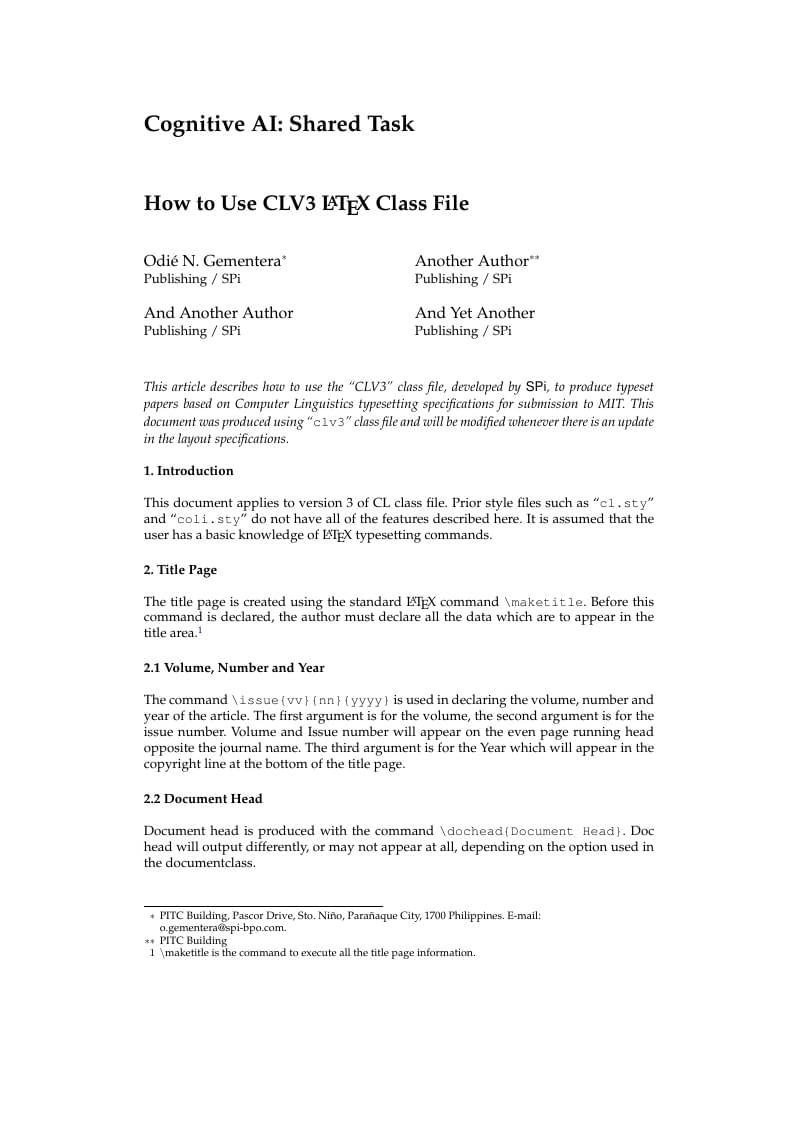
Paper template for the COGAI course (CLiPS - University of Antwerp)
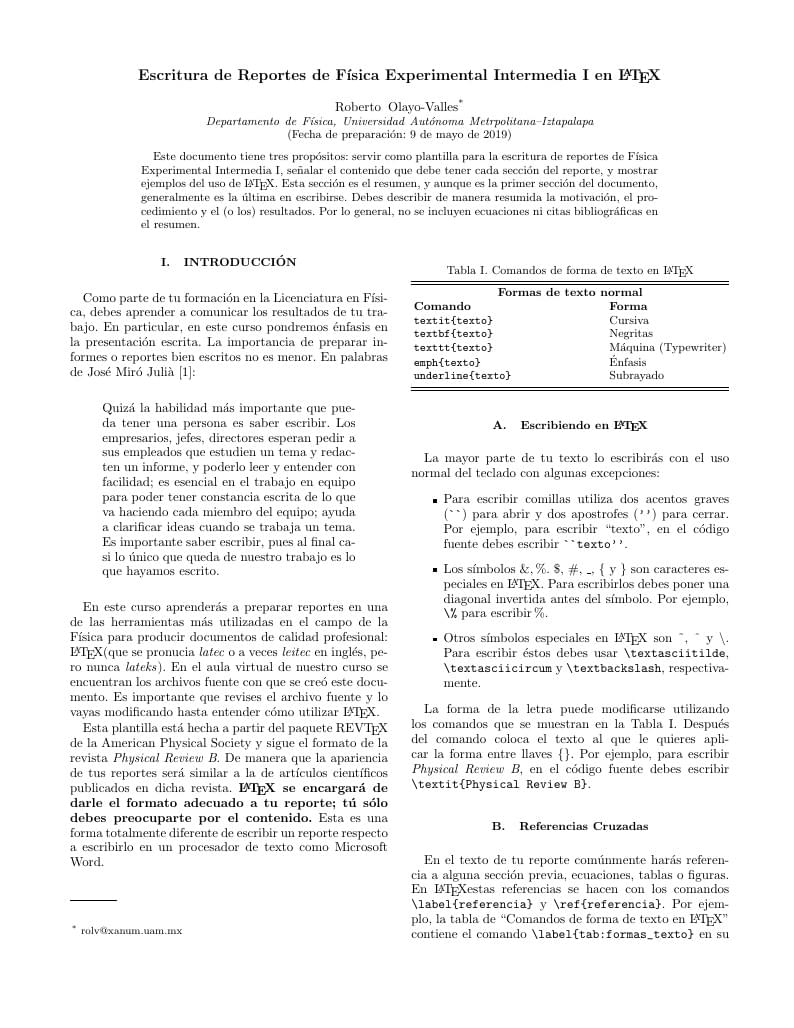
Plantilla para Reporte de Física Experimental
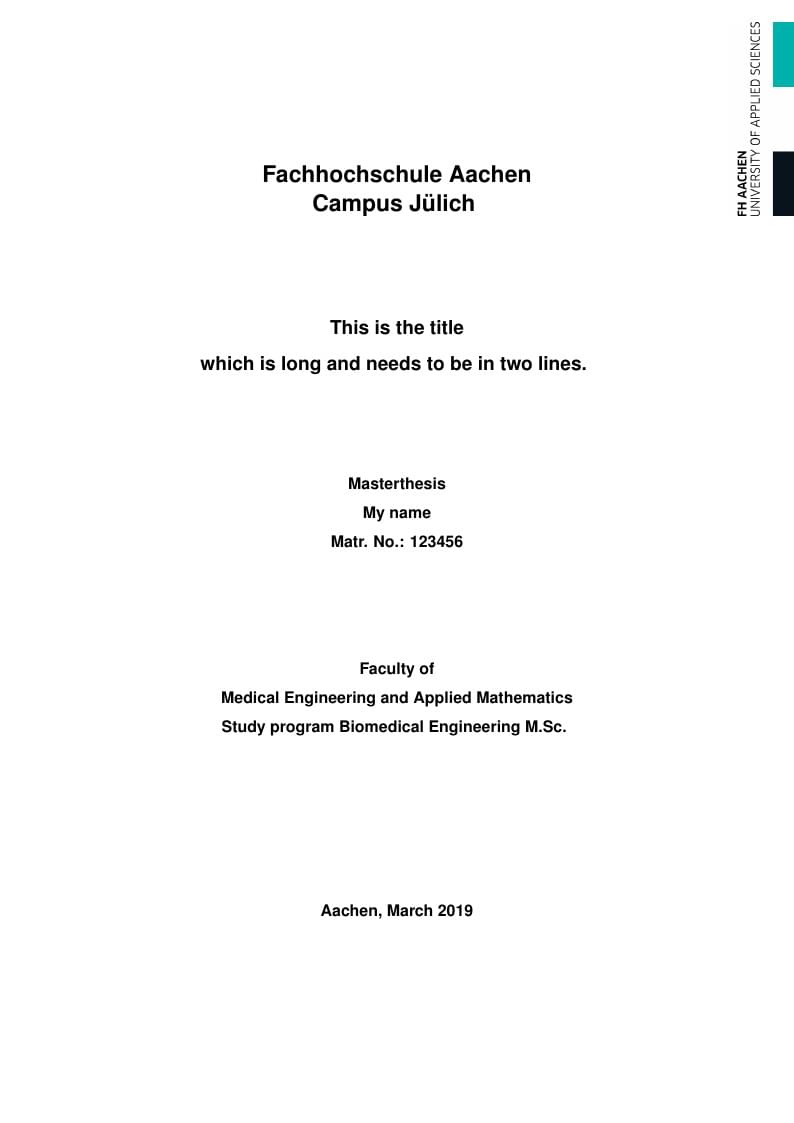
One-sided report for FH Aachen FB09 Medical Engineering and Technomathematics Vorlage für eine Abschlussarbeit an der FH Aachen FB 09 Medizintechnik und Technomathematik
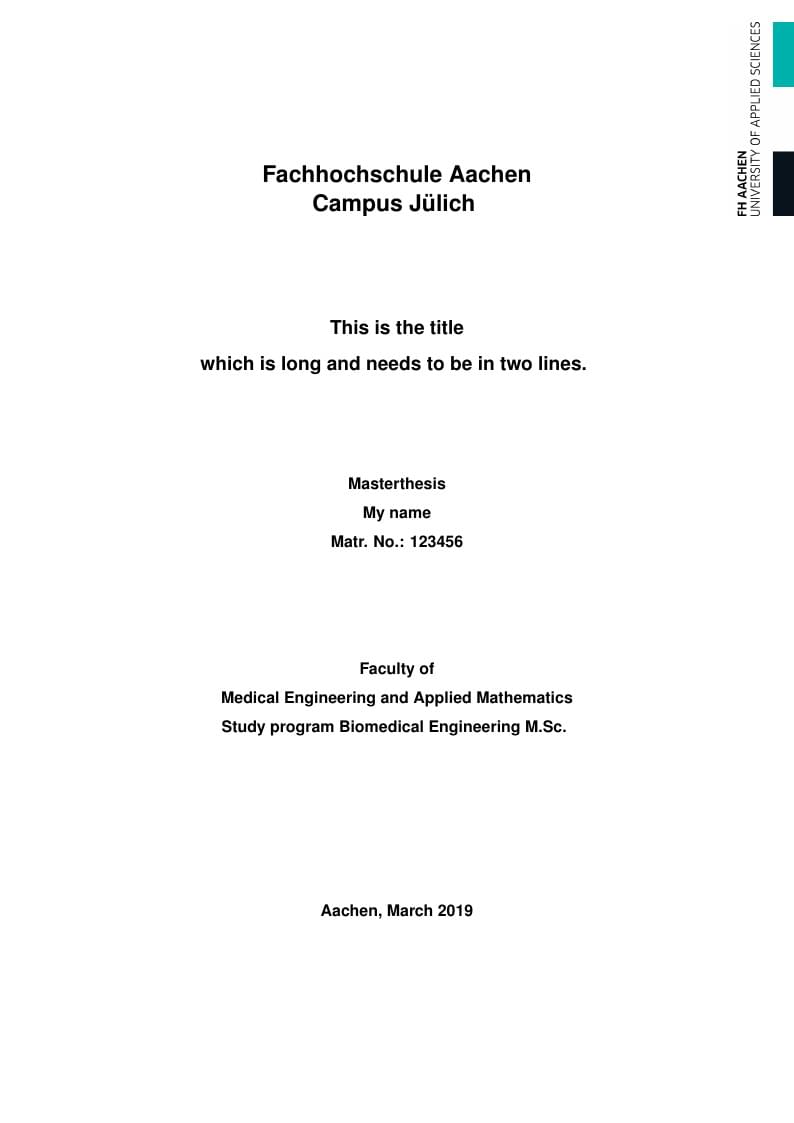
Layout for report or thesis at FH Aachen, FB09 Medical Engineering and Technomathematics Vorlage für eine Abschlussarbeit an der FH Aachen, genutzt in FB09 Medizintechnik und Technomathematik
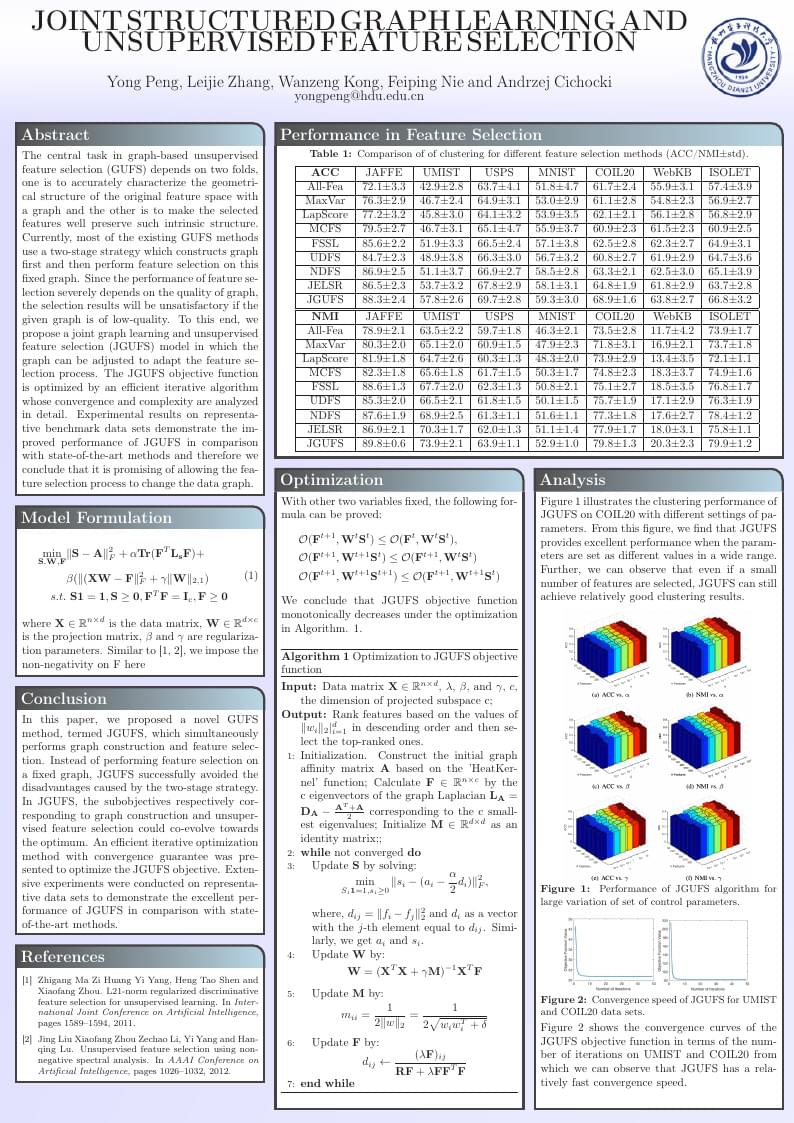
this is for the poster used on the ICASSP conference

This template is intended to be used in the IPST 2019 congress.
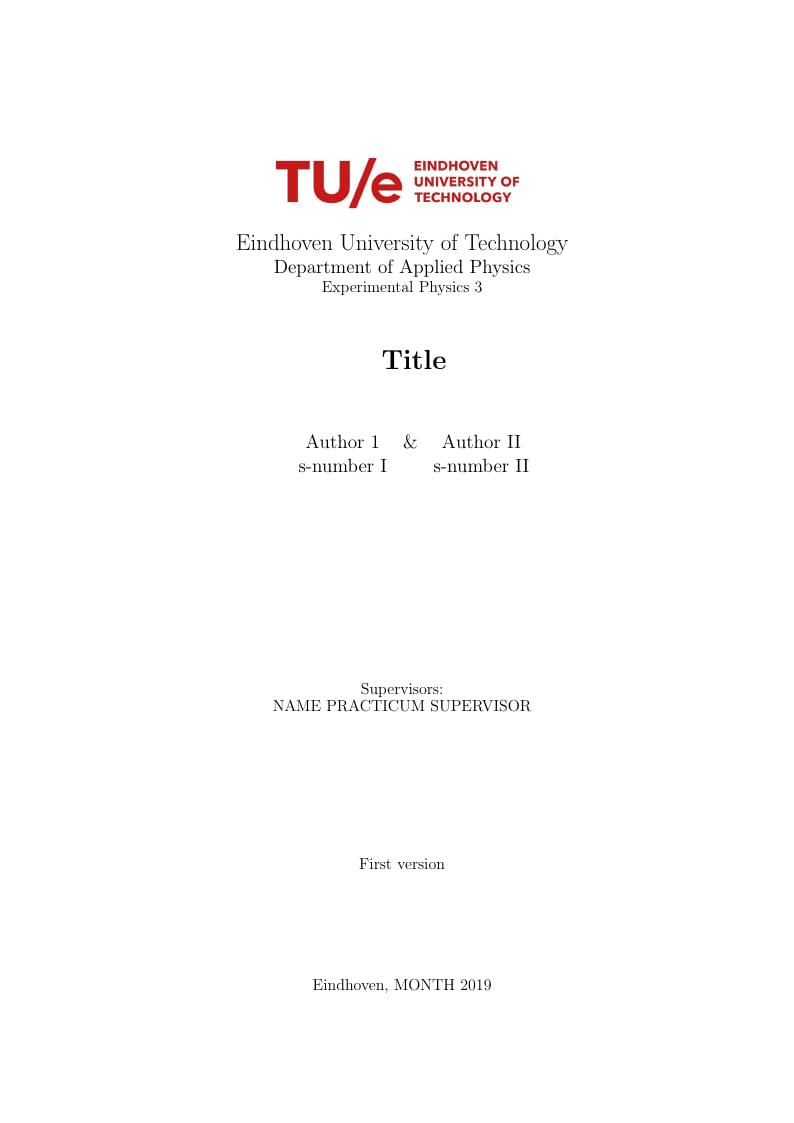
Template for writing lab reports at the Eindhoven University of Technology based on the template of Thijs Nugteren and Joos Buijs.
\begin
Discover why over 25 million people worldwide trust Overleaf with their work.