overleaf template galleryLaTeX templates and examples — Recent
Discover LaTeX templates and examples to help with everything from writing a journal article to using a specific LaTeX package.
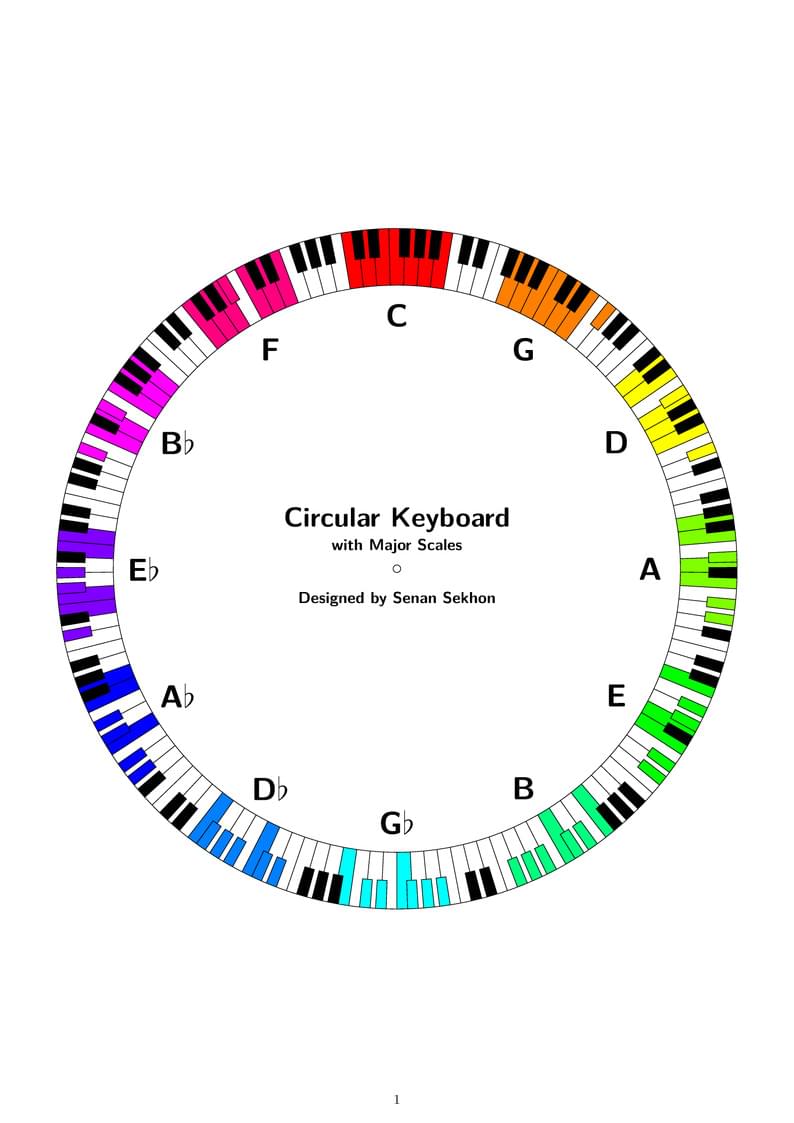
Circular Keyboard with Major Scales
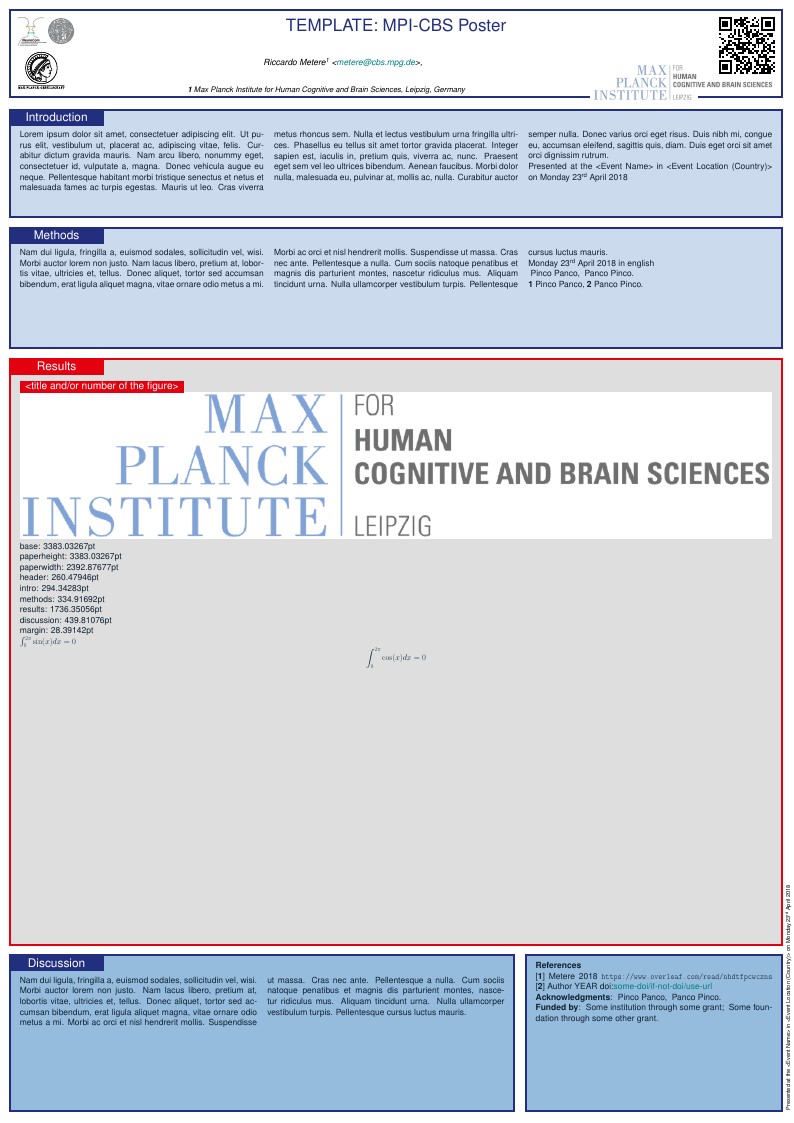
UNOFFICIAL style for Posters at MPI-CBS Max Planck Institute for Human Cognitive and Brain Sciences Leipzig, Germany
![[template] Postmortem (soen 390)](https://writelatex.s3.amazonaws.com/published_ver/17553.jpeg?X-Amz-Expires=14400&X-Amz-Date=20260728T170446Z&X-Amz-Algorithm=AWS4-HMAC-SHA256&X-Amz-Credential=AKIAWJBOALPNFPV7PVH5%2F20260728%2Fus-east-1%2Fs3%2Faws4_request&X-Amz-SignedHeaders=host&X-Amz-Signature=3d8de99df0945806fcf15ea0d17dfb988e050fb8e363723a1f24108b97390225)
Template for the Postmortem report
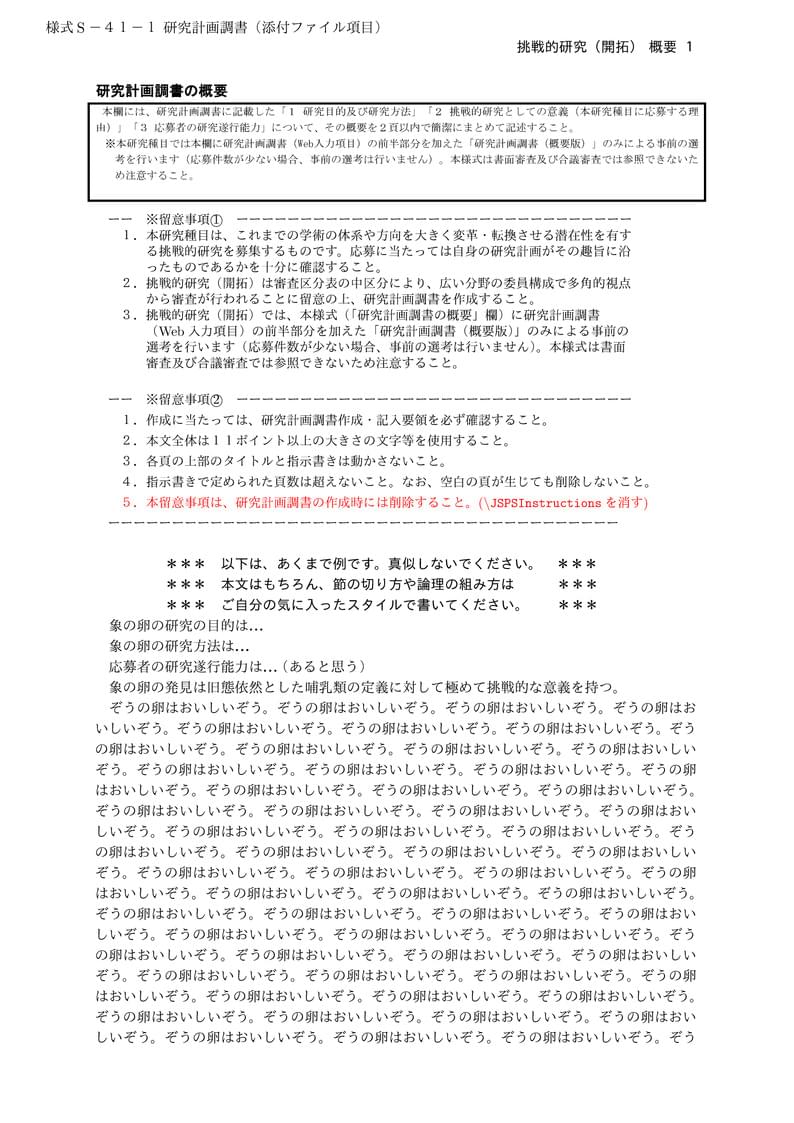
山中 卓 (大阪大学 大学院理学研究科 物理学専攻)先生が作成された科研費LaTeXを、坂東 慶太 (名古屋学院大学) が了承を得てテンプレート登録しています。 詳細はこちら↓をご確認ください。 http://osksn2.hep.sci.osaka-u.ac.jp/~taku/kakenhiLaTeX/
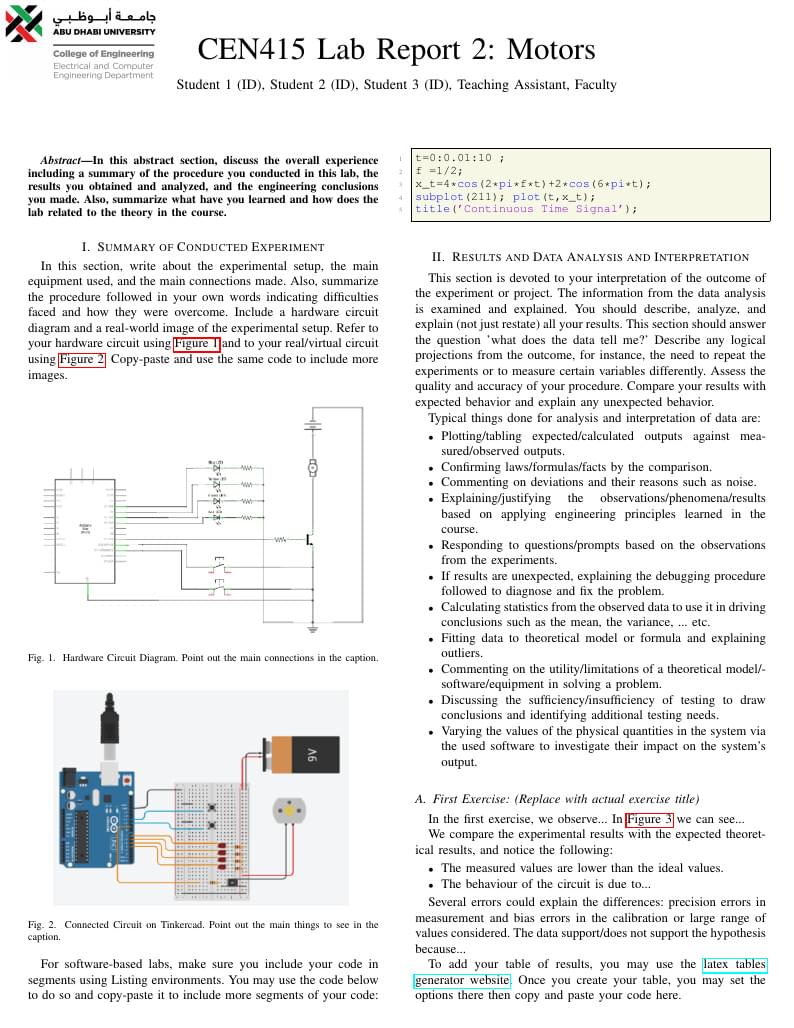
This lab report template is for use by Electrical Engineering, Computer Engineering, and Biomedical Engineering students at Abu Dhabi University. It is based on the IEEE Journal class developed by Michael Shell.
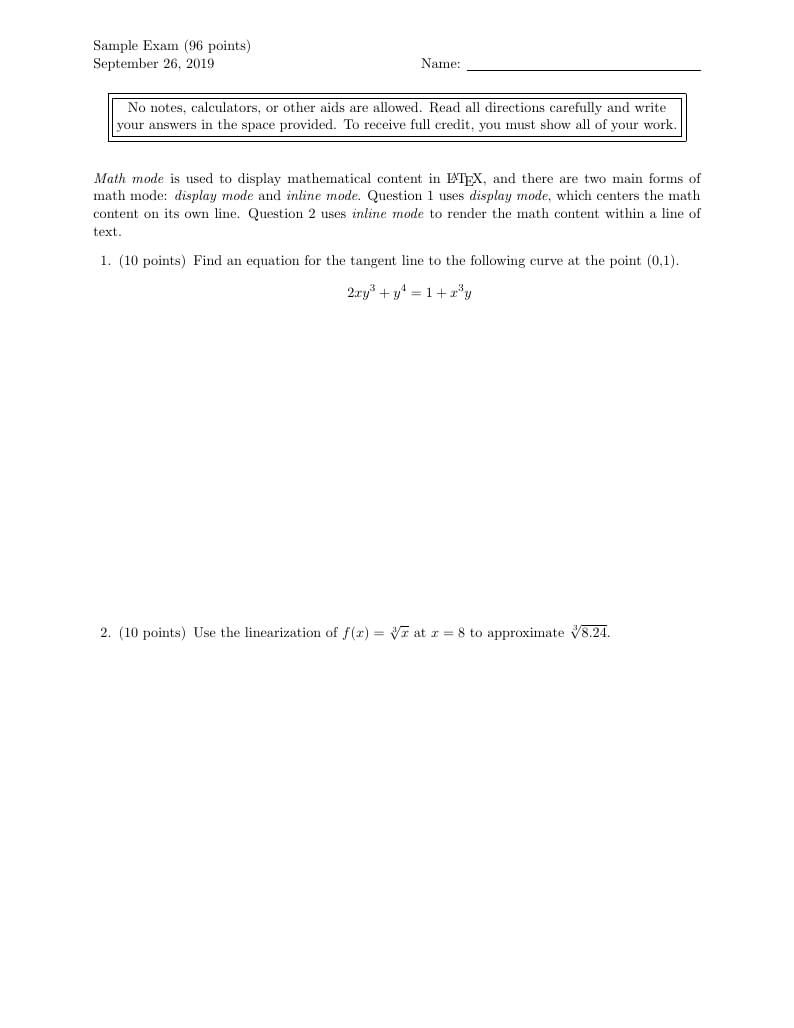
A sample of some problem types and LaTeX commands that may be useful in a math exam. Uses the exam document class.
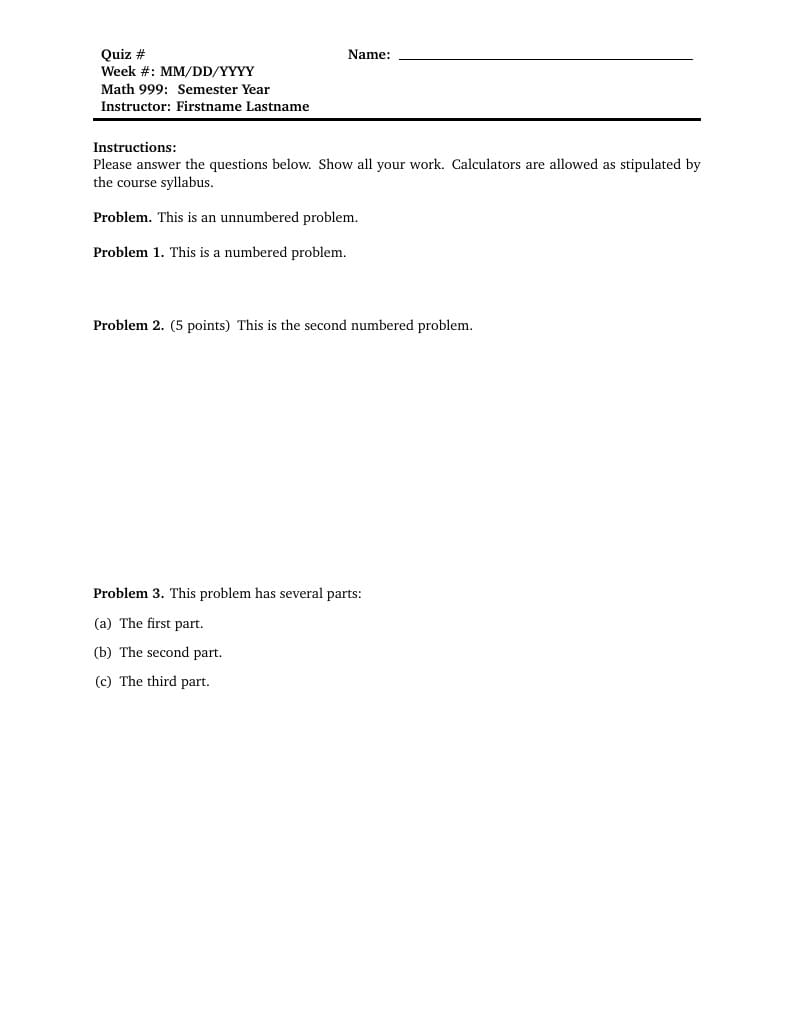
A template for creating course quizzes.
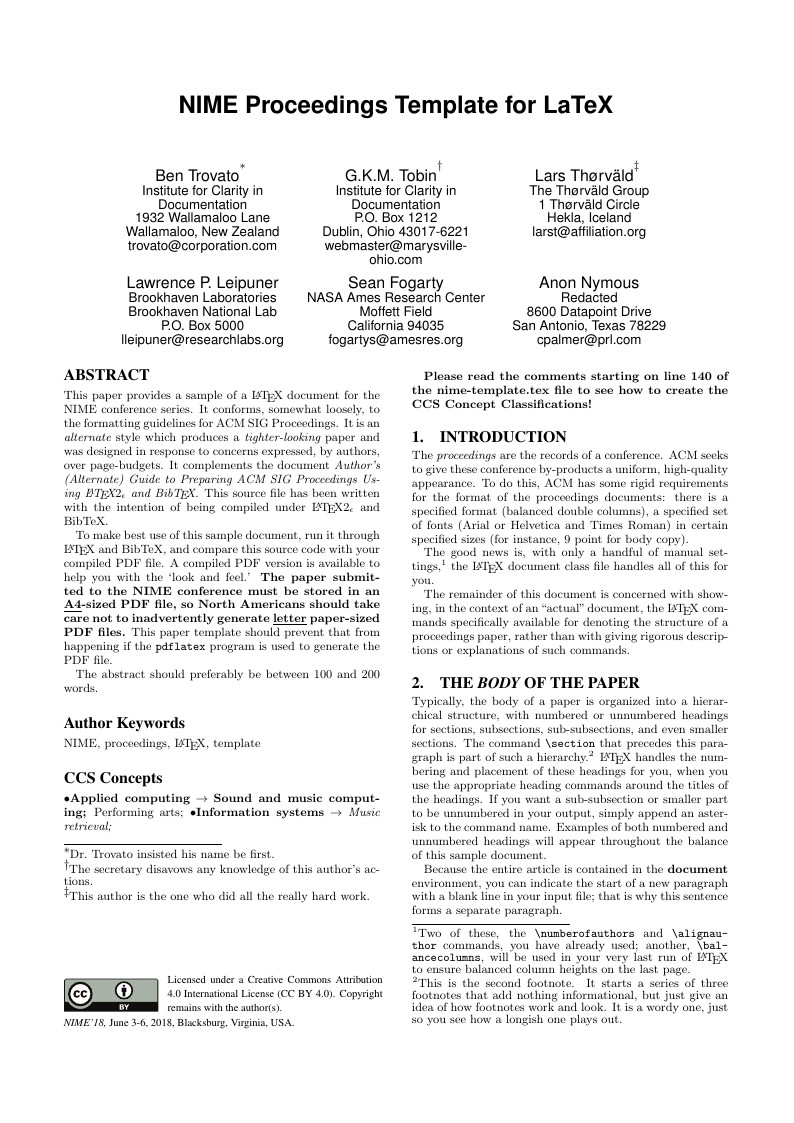
This paper provides a sample of a LATEX document for the NIME conference series. It conforms, somewhat loosely, to the formatting guidelines for ACM SIG Proceedings. It is an alternate style which produces a tighter-looking paper and was designed in response to concerns expressed, by authors, over page-budgets. It complements the document Author’s (Alternate) Guide to Preparing ACM SIG Proceedings Using LATEX2ε and BibTEX. This source file has been written with the intention of being compiled under LATEX2ε and BibTeX.
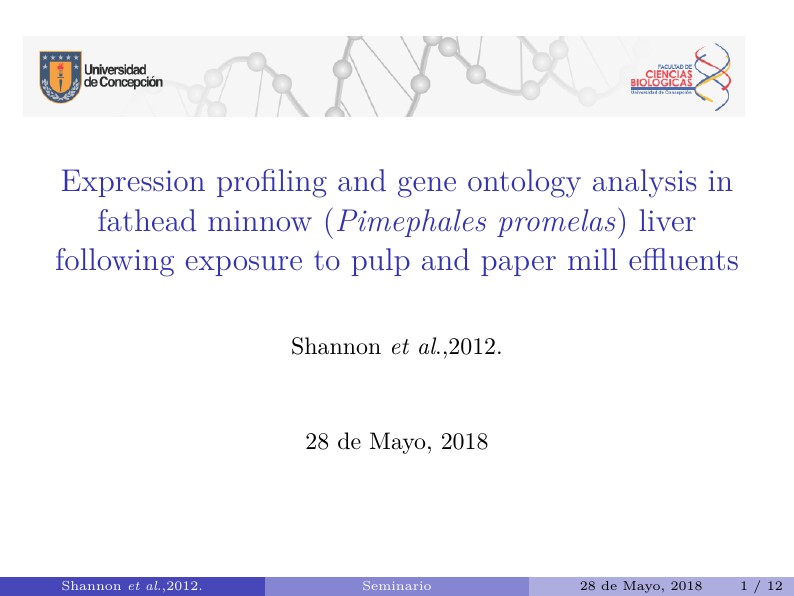
Trabajo que puede servir de guía para alumnos de la UdeC
\begin
Discover why over 25 million people worldwide trust Overleaf with their work.